Panama Canal Backlog Sparks Rebound for West Coast Container Volume

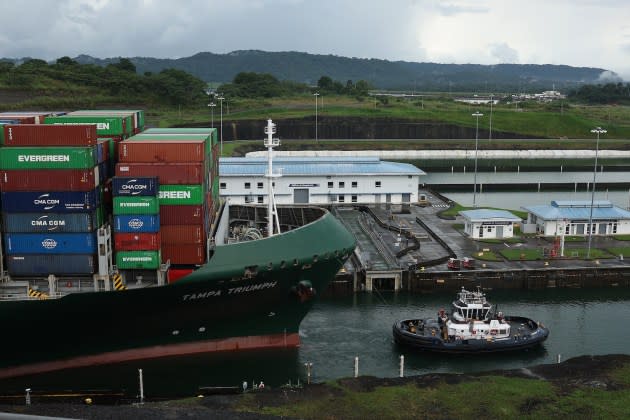
Plenty of chaos at both the Suez Canal and Panama Canal is threatening to snarl global supply chains, with the latter potentially playing a part in how many container ships are docking at U.S. ports.
The 10 largest U.S. ports had a 5.7 percent year-over-year increase in inbound volume in November, nearly twice the 2.9 percent annual increase seen the prior month in October, according to the monthly McCown Report from container shipping expert John McCown, non-resident senior fellow at the Center for Maritime Strategy.
More from Sourcing Journal
All Eyes on the Suez Canal as Container Shipping Giants Halt Passage Through Red Sea
Maersk, Hapag-Lloyd Suspend Shipping Through Red Sea After Houthi Attacks
But this growth could have actually been higher, with McCown pointing to delays at the Panama Canal as a contributing culprit.
In the report, McCown said there was a 29 percent decline in the number of large 10,000-to-14,000 TEU container ships going through the canal in November, ultimately preventing more ships from reaching the U.S. ports in their originally projected scheduled times.
McCown’s data illustrated that such delays could have led had an impact on coastal U.S. port volumes last month. West Coast ports showed a 24.5 percent year-on-year growth in container numbers, while there was an 8.5 percent dip at East Coast and Gulf Coast gateways—suggesting that more shipments from Asia are making stops on the West Coast instead of traversing the canal.
The West Coast gain was the largest such increase in inbound container volume in 30 months, nearly doubling the October gain of 12.9 percent. And for the East and Gulf Coast ports, the deterioration was nearly twice as deep as the October volume decline of 4.4 percent.
At the individual port level, the differences were even larger in November, with the Ports of Long Beach and Los Angeles reporting inbound container volume gains of 37 percent and 25.3 percent respectively, while New York & New Jersey volumes declined 13.1 percent and Port Houston saw volume dips of 16.4 percent.
According to McCown, November is the fourth straight month that East and Gulf Coast ports have underperformed their West Coast counterparts, after a run of 26 months where they had outperformed in growth.
Despite the shift back to West Coast ports, McCown still anticipates that over the longer term, more goods will be transported eastward for reasons related to underlying economic costs, total carbon emissions and congestion-related impacts.
McCown also expects more long-term growth in containers, pegging the annual increase at 2.7 percent per year.
“In the absence of new capacity, port after port is going to reach its limit,” McCown told Sourcing Journal last month. “The people that control those ports, both the carriers and the terminal operators—look at the earnings they had during Covid when there was a congestion and gridlock. Don’t expect those guys to be raising their hand and say, ‘Yeah, we need new capacity.’”
With November out of the way, McCown said inbound volume gain in December will likely be more pronounced.
Despite the holdups related to current events, inbound container shipping into the U.S. may finally be on more consistent footing after years of rough year-over-year comparisons related to the Covid-19 pandemic.
For example, there were 15 straight months of year-over-year decreases in inbound container volume across all 10 U.S. ports measured, with the 11 months before September showing double-digit percentage decreases.
But the massive disparity during those months can also be attributed to prior pandemic volume spikes, which persisted heavily throughout 2021 and 2022 as U.S. consumers spent stimulus checks and online spending accelerated.
“We are back to year over year changes being more fundamentally driven by underlying economic activity, as we are past the periods where such changes were driven by difficult earlier comparisons,” McCown wrote in the report.
For example, November saw a 9.3 percent decline in sequential inbound volumes to 1.77 million 20-foot equivalent units (TEU) from October totals, which marked the conclusion of the pre-holiday peak shipping season. But the decline was an improvement of last year’s 11.6 percent sequential decrease.
McCown’s report also touched on freight rates, indicating that October pricing on aggregate is 6.4 percent below averages calculated through the 2023 third quarter based on data from Container Trade Statistics (CTS).
The CTS global pricing index is an aggregate measure of all loads actually moving—encompassing both spot rates and contract rates—based on data provided by the carriers. It is measured in nominal dollars against 2008 pricing, which is set at 100.
At an index of 69, October pricing is down 4.2 percent from the September index of 72. The index is 31 percent below what it was 15 years ago, McCown observed.
