What are chances a hurricane will hit the MS Coast? Experts offer predictions by county
Mississippi and its coastal counties have far higher than average chances of seeing hurricane damage this season, researchers say.
The three coast counties have at least a 48% chance of damage from a named storm, with a 23% or higher chance of a hurricane, according to research scientists with Tropical Weather & Climate Research at Colorado State University.
Chances this season of a major hurricane — Category 3 or higher — this season on the Mississippi Coast are less than 10%, the researchers found. The same team each year forecasts the number of hurricanes expected in the Atlantic basin.
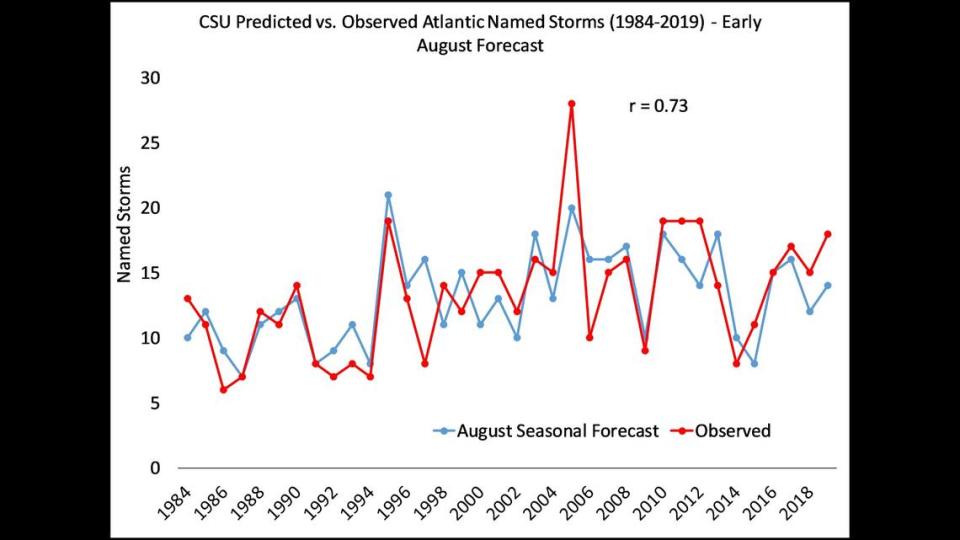
Colorado State University has been putting out its much-anticipated hurricane forecast for 40 years.
Since 2021, CSU researchers also have been calculating the probability of hurricane impacts for each state and county on the Gulf and East coasts and in other areas of the Atlantic Basin.
The projected probabilities for a named, land-falling storm within 50 miles of a location are based on a combination of the historical record (1880-2020) from the National Oceanographic and Atmospheric Administration and the accumulated cyclone energy, a wind energy index, forecast for the upcoming hurricane season.
The higher probability of hurricane impacts dovetail with the “well above average” hurricane season CSU researchers are forecasting. The CSU forecast, released in April, will be updated June 11, July 9 and Aug. 6. NOAA’s National Weather Service also is forecasting an above-average season.
“Our goal is to help people be prepared,” CSU research scientist Levi Silvers told the Sun Herald. “The hope is that by helping people be ready and be prepared, there’s less stress involved.”
Hurricane probabilities for South MS
CSU’s landfall probability forecast is another indicator that Gulf Coast residents need to prepare for hurricanes. Hurricane season started June 1 and runs through Nov. 30, with the most activity between mid-August and mid-October, according to NOAA’s National Hurricane Center.
Because of record-breaking North Atlantic Ocean temperatures, La Nina conditions that will reduce wind shear and other factors, the probability of hurricane damage is higher for most areas, including the Mississippi Coast.
Here are some of the CSU team’s key predictions for damage from a named storm in 2024 for each coastal county and Mississippi as a whole:
Hancock County: 48% — probability of named storm; 23% — probability of hurricane; 7% — probability of major hurricane.
Harrison County: 51% — probability of named storm; 27% — probability of hurricane; 7% — probability of major hurricane.
Jackson County: 49% — probability of named storm; 25% — probability of hurricane; 9% — probability of major hurricane.
Mississippi: 72% — probability of named storm; 43% — probability of hurricane; 13% — probability of major hurricane.
By contrast, the average probability of hurricane damage is 28% for Mississippi, 14% for Hancock County, 17% for Harrison County and 16% for Jackson County.
Harrison and Hancock counties experienced damage from major hurricanes only six times from 1880-2020. But Jackson County has suffered damage from major hurricanes eight times during the same period, NOAA records show.